
@TDAM_Canada
Investor Knowledge + 5 Minutes = New Thinking
When it comes to Exchange-Traded Funds (ETFs), there is certainly no shortage of options for Canadians. There are currently over 1300 ETFs listed in Canada that provide access to all the major asset classes, sectors and geographic regions as well as many key investment strategies1. Of particular interest (for the purpose of this blog at least) are the ETFs that focus on Canada's beloved "big 6 banks."
There are quite a few ETF options available for Canadians that offer exposure to the big 6 Canadian banks. These ETFs can have very similar approaches to their weighting of the various banks. Two of the types of strategies are:
- Strategies that provide equal-weight exposure, which invests the same weight in each of the 6 banks.
- Strategies that innovated on this equal weight approach and overweight and underweight based on a specific criterion. Some rely on mean reversion, which will likely put more weight in companies that recently underperformed and less weight in companies that recently outperformed with the idea that they'll likely both converge to the mean. Other strategies focus on metrics such as dividend yield, which is found by dividing the dividend amount by the price.
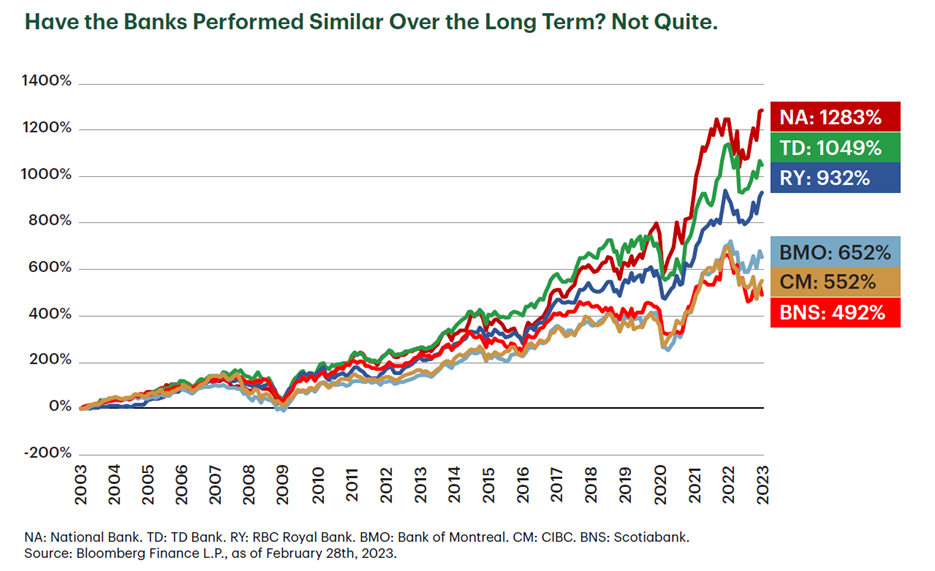
These strategies all do one thing very well, and that is to provide exposure to the big 6 banks in a one-ticket solution. The one key element that these strategies have in common is that they rely on the banks performing similarly over the long run. At first thought, that sounds about right. So, in reality, have the banks all performed roughly the same in the long run?
Not quite.
Over the last 20 years, the total returns of the big 6 Canadian banks have indeed all moved toward an upward trend. However, three banks have materially outperformed the rest.
Why the outperformance?
There is one measurement that is essential to any business, and that is earnings growth. The next question for a company is what they do with those earnings. Three common uses include:
- Reinvest in the company
- Buy back shares
- Pay dividends
To simplify things, if a company is growing their dividend payments, this is typically a result of strong earnings growth, and if earnings are growing, a company's stock price will likely rise as well. So, have the banks been growing their dividends against the backdrop of strong earnings growth?
簡單來說,是的。
Canada's big 6 banks have collectively grown their dividends by almost 400% over the last 20 years2. As a collective, the banks have regularly increased dividends over time, but how about individually?
During the last 10 years and 20 years, banks that have increased their dividends the most were also the best performers most of the time2. In both timeframes, the top three performers were also the top 3 dividend growers.
Now, if only there was an ETF in Canada that could use this information to formulate a strategy to Canadian bank investing.
A unique Canadian bank dividend investing strategy
Leveraging extensive research on the correlation between earnings growth and dividend growth for Canadian banks, TD Asset Management Inc. (TDAM, "we") has built an innovative Canadian bank ETF, TD Canadian Bank Dividend Index ETF (TBNK), providing more options and opportunities for investors.
We worked with Solactive, an indexing company, to build a custom index that follows a unique rules-based methodology that puts a higher weighting in the banks that grow their dividend the most. Specifically, once a year the index will rank all constituents from 1 to 6, based on their 12-month trailing dividend growth. The best ranked bank will get the highest weighting, the second best ranked will get the second highest weighting and so on. The portfolio then will rebalance to these weights on a quarterly basis.
We believe this to be a more unique and rewarding strategy because banks with the highest levels of profitability, and superior execution through a business cycle, will ultimately increase their dividends more quickly than their peers.
1 Source: Morningstar Direct. Data as of April 11, 2023.
2 Bloomberg Finance L.P., as of December 31, 2022. The above shows the sum of the dividend per share of the 6 big Canadian bank equity securities. Tickers: TD, RY, CM, BNS, BMO, NA.
本文所含資訊由道明資產管理有限公司提供,僅供參考。內容乃出自可靠之來源匯編而成。圖表僅供解說之用,並不反映任何投資的未來價值或未來表現。本文並不提供任何財務、法律、稅務或投資建議。衡量個別投資、稅務或交易策略時,應考慮個別人士的目標和風險承受能力。
本文檔中的部分陳述可能包含預測性的前瞻性陳述(「FLS」),其中包含「預計」、「預期」、「打算」、「認為」、「估計」和類似的前瞻性表述或其否定形式。前瞻性陳述基於當前對未來普遍的經濟、政治、相關市場因素(例如利率和匯率、股票和資本市場)以及普遍經營環境的預計和預測,並假定不發生稅法或其他法律或政府管制方面的任何變動或災難事件。對於未來事件的預計和預測本身受無法預見的風險和不確定性的影響。此等預計和預測可能在未來並不準確。前瞻性陳述不是對未來表現的保證。實際發生的事件可能與前瞻性陳述明示或暗示的事件存在實質差異。包括上文所述各項因素在內的多個重要因素均可能造成這種背離。您不應在任何程度上依賴於前瞻性陳述。
道明資產管理有限公司 (TD Asset Management Inc.) 是道明銀行 (The Toronto-Dominion Bank) 的全資擁有附屬機構。
®TD標誌和其他TD商標為道明銀行或其子公司的產權。